Olivier Drouin

The Professionals Cohort (Quebec, Canada)

Click above to listen to our interview with Olivier Drouin!
Olivier Drouin (Canada – Quebec)

Olivier Drouin ventured into the treacherous waters of reporting cases in COVID-19 schools when Quebec dodged the responsibility last August.

Despite the lack of transparency in many schools, Olivier worked with teachers unions, parents, and schools to produce his data analysis on COVID-19 in schools.

Infectiously kind, gracious, and humble, Olivier took on the task of reporting school cases in Quebec, much in the same way The Covid Monitor did in the United States.

Drouin appeared on “The Most Fascinating Montrealer” podcast and was featured in major news outlets for his work.

A recent research paper used Olivier’s data from Covid Ecoles to examine school cases trends in Montreal, Canada, bolstering his dutiful work and giving him substantial academic cred.

“I am a team of one – single parent of two teenage daughters and VP technology for a large company in Montreal,” Olivier said. “This is volunteer work and I have spent at least 1000 hours since August 26th, 2020.”

Olivier Drouin’s website greets visitors with a pointed note:

The mission of this citizen initiative for transparency of data on schools affected by COVID is to make information available, accessible and intelligible in real time to school stakeholders (parents, teachers, staff members).

The site uses the creativity, intelligence and know-how of the community to create content, develop ideas, solve a problem or carry out an innovative project, all at a lower cost. This approach is commonly known as crowdsourcing.

The project is based on the strength of collective intelligence using crowdsourcing. The site publishes the number of schools affected by at least one positive case of COVID since August 26th.

The information comes from the public and is validated with a copy of the letter issued by public health or the school administration. This list is an evolving and non-exhaustive list. It is updated several times a day. You can submit positive COVID cases in your schools, whether you are a parent, teacher, service center employee or citizen.

https://www.covidecolesquebec.org/
Olivier’s website, CovidEcolesQuebec.org.

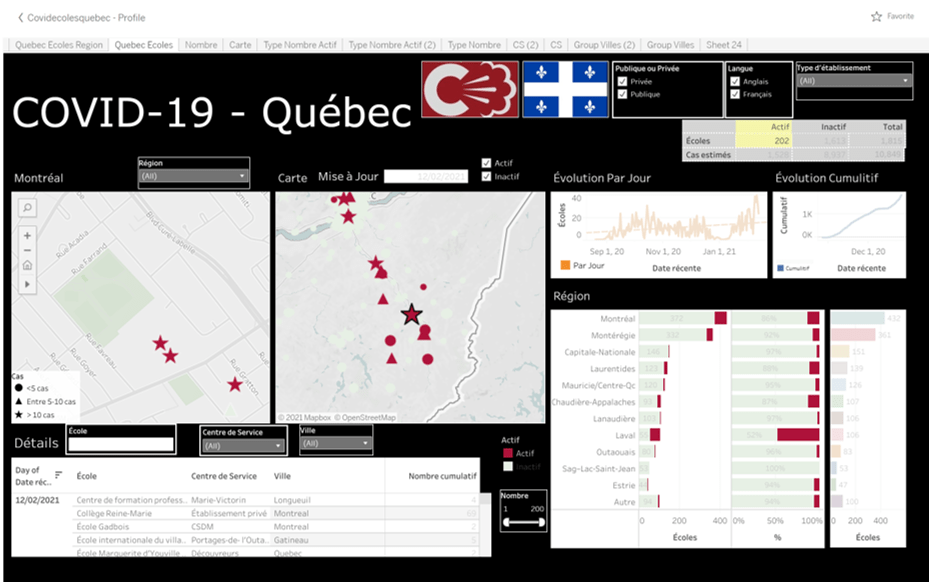
Drouin, who lives on Nuns’ Island, started tweeting about the pandemic in the summer, concerned about the government’s back-to-school plan. In September, Drouin founded a volunteer website, CovidEcolesQuebec.org, posting cases of COVID-19 in schools across the province, based on letters by principals sent to him from parents. The website quickly became one of the most visited in the province.

Drouin has also advocated for better ventilation in schools, including the installation of portable air purifiers in classrooms.

“Twitter has a real-time aspect to it, contrary to other social media,” Drouin explained.

Cases by grade-level groups on Olivier’s website, CovidEcolesQuebec.org

“It is easy to connect quickly on content with experts (from) around the world on a given topic. When it came time to launch CovidEcolesQuebec.org, it was simply an extension of my community involvement and I felt it was important to create a separate account to promote the site and create a community of like-minded followers that would amplify the message and help make this crowdsourcing website a success.”

All of the data Olivier collects is public and easily accessible. Click here to download the raw data.

A few words from those who nominated Olivier:

“One parent, as a volunteer work, has been tracking all Quebec Covid cases in school since August 26th, at a time when the government was refusing to disclose the data. Using crowdsourcing method, he publishes official letters sent by school and public health to parents that confirm a case and compiles it in real time on a geospatial map. He manages also a twitter account and Facebook page. he was mentioned by elected officials at the national assembly of Quebec, covered in other 200 news media articles and name Most fascinating Montreal of 2020 by CJAD radio.”

Click here to visit Olivier’s website. Click here to access his raw data and dashboard.

Click here to follow Olivier on Twitter at his personal or Covid Ecoles handle.

Megan Messerly

The Press Cohort (Nevada)

Megan Messerly’s 40th post in her weekly “Coronavirus Contextualized” series is the epitome of high-quality data reporting.

Megan Messerly (Nevada)

Whatever data is out there, Megan pulls in, analyzes and, as the title suggests, puts into context.

Her work for the Nevada Independent put her at the top of the pack in our Press Cohort, and rightfully so – her work manages to take the wealth of data that could be overwhelming and make it easily consumable, understandable, and accessible.

“It is not possible to independently calculate the test positivity rate based on test encounters because the state only reports the number of positive cases, not the number of positive test encounters,” her latest post noted. “However, the state does provide this number, calculated as an average over a 14-day period with a seven-day lag. As of Wednesday, that number was 11.3 percent, down from a high of 21.7 percent on Jan. 13. In September, before cases started to increase, the test positivity rate was 6.1 percent — meaning that test positivity is still nearly double what it once was.”

In her own words:

“In early March, when Nevada announced its first two cases of COVID-19, there was nowhere to turn for reliable data. The data lived scattered among various state and county websites and press releases.”

“So, I created The Nevada Independent’s first COVID infographic — which lived in our weekly live blogs — nearly a week and a half before the state set up its data portal. Since then, I’ve detailed and analyzed the latest COVID data in Nevada in my “Coronavirus Contextualized” series, which has published almost every single week since April 1.”

“In June, I transitioned the infographic into a full-fledged data page, which I, by myself, have updated multiple times a day, every single day, since then, including weekends and holidays.”

“I do want to give a shout out to my colleagues, who helped me with data collection for the first couple of months of the pandemic, and to our chief technology officer CJ Keeney, who helped me set up the backend of our data collection process and who is always there to answer any questions I have when something goes awry.”

View a sample of Megan’s work below

Click here to read the above article.
Click here to read the article

“To me, I think the most important part of my reporting, whether the graphics, the “Coronavirus Contextualized” series, or other individual stories I’ve written, has been providing clear information to Nevadans — not only keep them informed about the reality of the situation in our state, but to help them make educated decisions about what steps they are going to take personally to respond to the pandemic. I’m so grateful to everyone who has followed along for the last year!”

A few words from some of those who nominated Megan:

“Megan has reported our daily case, test positivity and hospitalization numbers, as well as the corresponding graphs, every day through the pandemic. She gives cliffs for every conference call of our state COVID team. She’s accessible and puts up with all the crap that the anti-maskers can give her.”

“Megan originated the “Coronavirus in Nevada” site early in the pandemic and has been the main staffer to keep this data site populated. We, as users, know that it is reliable and up to the hour with the latest data. And it’s very comprehensive, especially with the county by county statistics. Plus, her Twitter account and health newsletter keeps us informed on statements from health officials and where we can get vaccinated. Living in a rural county with no TV station, I would have felt so underinformed without her. She is Las Vegas-based, but does a wonderful job with informing residents of other counties, including little old Elko Co. where I live. And the best part is that she still maintains her beat covering politics and other health issues. A tireless journalist with a VERY appreciative Twitter following. We never want her to leave Nevada Indy, but when she gets interviewed by national media, we are reminded that someone will make her an offer she can’t refuse.”

Click here to follow Megan on Twitter

Click here to see some of Megan’s reporting.

Andrew Berens

The Professionals Cohort (Louisiana)

Andrew Berens, a population health and geospatial analyst with the Louisiana Department of Health, built and has maintained since March 2020 the Louisiana COVID-19 Information Dashboard.

Andrew Berens (Louisiana)

Andrew has worked to make COVID data consistently and transparently available to the public and local officials.

In addition to the public facing work, Andrew assists the state with data cleaning and processing, and he response to request for assistance from data users, making the state’s data more widely available.

A few words from those who nominated Andrew:

“Andrew worked quickly in March to establish one of the first state-level COVID dashboards when the first Louisiana case was reported, publishing one up in time to report Louisiana’s first death. Since then he has continuously worked to improve data quality and increase transparency, advocating to make high-quality data easily downloadable. Now that the vaccine rollout has begun, Andrew has stepped up on the team tasked with cleaning, enriching, validating, and reporting vaccination data as well to ensure these data are also accurately and transparently shared with the public.”

“Throughout the pandemic Andrew has worked directly with local officials, answering questions and helping to integrate state data in to their local informational products. He has also taken time to answer citizen questions regarding the dashboard, ensuring the people of Louisiana understand the data being presented.”

Click here to follow Andrew on Twitter.

Dr. Anne Zink

The Specialists Group (Alaska)

If the true measure of a person’s character can be derived from how they treat their inferiors, then Dr. Anne Zink would score aces.

Dr. Anne Zink (Alaska)

Members of her team have publicly praised her expertise, humility, and empathy.

“She encourages Alaskans to take care of each other, and to check in on neighbors who may need a helping hand,” wrote Sarah Erkmann Ward, an Anchorage communications consultant who worked with Dr. Zink during the crisis.

“She is the right person at the right moment that we never knew existed,” Erkmann told Alaska Public Radio.

Dr. Zink is the Chief Medical Officer for the Alaska Department of Health and Social Services, and she began her regular updates on COVID-19 long before the virus reached her state.

“I want to make sure you have the latest information at your fingertips,” Dr. Zink wrote in her monthly newsletter in February 2020.

Dr. Zink’s team developed user-friendly web tools for Alaskans to see if they’re eligible for vaccines and make vaccine appointments.

Alaska Public Media wrote about Dr. Zink’s dedication and skill with communicating complex science with the public.

She’s also been widely praised for… her ability to work with others, project calm under pressure and communicate in a clear and relatable way.

Alaska Public Media, April 2020

A few words from those who nominated Dr. Zink:

“Dr. Anne Zink from Alaska is a total badass and has been keeping us up to date with accurate data since early March 2020”

“Using a data driven approach, she has wonderfully informed Alaskans about how actions have consequences in the covid crisis (both positive and negative) She has a great humility, but is so deserving of awards! “

Click here to follow Dr. Anne Zink on Twitter.

Award note: Dr. Zink has requested that she not be considered a finalist or be awarded any monetary prizes due to her position with the state.

Eilzabeth Shulok

The Provocateurs Cohort (California)

Eizabeth Shulok started tracking COVID-19 in California in May 2020.

Elizabeth Shulok (California)

Using her expertise as a data scientist, she built her own website to track, analyze and visualize data in San Diego County.

“The data tells the story; I just paint the picture,” said Shulok.

Elizabeth works with the press to produce accurate data visualizations, including a recent project to map the CDC schools guidance by zip code in her state.

Elizabeth wrestled with the pushback she received when she started reporting on cases in K-12 schools, finding that many in San Diego county (and online) would harass, threaten and berate experts who cautioned about what was known and what was speculation about kids, teachers and school staff.

“The violence coming from some of the pandemic deniers has made me hesitant to post openly about COVID-19,” Elizabeth said.

Despite the risk, Elizabeth pressed on, continued to track and report cases (including cases in schools), and challenged early misconceptions and lack of transparency in her area.

“I wasn’t convinced we knew enough about the role children play in the pandemic so I decided to see what the data shows,” said Shulok. “The county provides data on COVID-19, but doesn’t display it in a way to see how transmission varies by age group over time. So I created my own charts to try to get a better picture of what is happening with kids in San Diego County and ended up expanding from there.”

Elizabeth feared for her own safety at times, even going so far as to remove her name from her projects. But seeing activists using her data confront the anti-science crowd online and in the news encouraged her.

“It has shifted my perspective. And seeing them go on air, doing interviews to counter the Reopen Now group’s narrative, and getting bashed online, puts my work into perspective. What I’m doing is fairly neutral and less controversial,” she said.

Elizabeth provides all of the data free to the public with complete transparency of where it comes from, which is almost entirely primary sources.

A few comments from those who nominated Elizabeth:

“Her data analysis has provided insights and views that have illuminated areas of concern, highlighted gaps in tracking and brought into question policies in place.”

“As a concerned parent and data scientist, Liz used her skills to compile an amazing data dashboard, coding to periodically scrape data from publicly available sources in an easy-to-use, centralized format to help better under the role of schools in the coronavirus pandemic. Since we know that asymptomatic spread and a lack of testing are leading to serious undercounts, Liz’s dashboard provides a critical lower bound of confirmed, official cases and other data points that allow for better policy decisions knowing it is the tip of the iceberg.”

Click here to follow Elizabeth Shulok on Twitter.

Click here to see Elizabeth’s website.

Garrett Archer

The Press Cohort (Arizona)

Garrett Archer (Arizona)

Better known as “The Data Guru of Arizona” and “The Count of Phoenix,” Garrett Archer led the pack (or the cauldron?) as a investigative data journalist for ABC 15 News, providing frequent, transparent and accessible data and analysis during COVID-19.

Garrett’s meticulous attention to detail, meaningful analysis, and outgoing personality gained him regional and then national notoriety as an honest and data-driven reporter.

“Garrett loves nothing more than pouring over data to find a deeper understanding for stories of the day and stories that are pertinent to the community,” says his ABC 15 news profile.

Garrett quickly became one of our most frequently submitted nominees, as his work with ABC15 in Phoenix impacted the entire U.S. Southwest, where transparent data and reporting remained scarce throughout the pandemic.

He’s not afraid to call out failures or to celebrate success when warranted. And when Garrett caught COVID-19 in January, he made a point to talk about his experience publicly.

In the vaccine-rollout madness, Garrett keeps people informed of when and how Arizona and its surrounding states change the eligibility requirements:

Despite the emotional and psychological toll that comes with being a journalist assigned to cover COVID-19, Garrett brings levity into the fold as often as he can, using code and data to cheer people up.

A few words from those who nominated Garrett:

“Garrett Archer, Phoenix’s Data Guru from early on in covid has posted daily information, metrics and numbers related to COVID. His tweets have been daily and have posted current and up to date. He also has made a daily tweet showing the Navajo Nation pandemic information and is one of the few outside of the reservation.”

“Garrett has dedicated his work to sifting through AZ’s COVID data, and giving straightforward analysis and showing us trends from throughout the pandemic! I see his data as more helpful and inclusive of the pandemic, in comparison to the state’s DHS dashboard. In a world with numbers and info being flung everywhere, Garrett continues to be a warrior across all fronts, with the addition of vaccine updates in his daily drops! I think I can speak for many of the residents of arizona, by saying that his data analysis has highlighted Arizona’s successes and failings during these hard times. it’s allowed me to adjust what I’m doing in order to keep people safe.”

Click here to follow Garrett on Twitter.
Click here to see Garrett’s reporting with ABC15 News.

Misty Oprin

The Newcomers Cohort (Arkansas)

Misty Orpin launched her Arkansas Covid tracking site in March 2020 to make the Arkansas Department of Health’s Covid-19 data more accessible and transparent to its people.

Misty Oprin (Arkansas)

A novice to the complexities of epidemiology, Orpin focused on visualization, geographic specificity, and active Q&A with Arkansans on Twitter and via email.

The organization evolved into a watchdog role, attending press conferences and striving for clarity from the Arkansas Department of Health and the Governor.

Orpin partnered with the University of Arkansas to bring on an intern to assist with demographic information, and eventually turned the project over to the University of Arkansas’ Department of Journalism after six months of 12-hour days bringing the latest data and updates to Arkansas.

The project is now student-run and continues to provide daily updates and in-depth news stories on the impacts of Covid in Arkansas.

A few words from those who nominated Misty:

“Misty Oprin began the @ArkansasCovid project and was invaluable to me the first several months to make sense if Arkansas covid data!”

Click here to follow Arkansas Covid on Twitter.

Click here to see the Arkansas COVID website, now managed by the School of Journalism and Strategic Media at the University of Arkansas.

Click here to follow Misty Oprin on Twitter.

David Marconnet

Professionals Group (Alabama)

David Marconnet (Alabama)

David Marconnet started Bama Tracker as a side project to help Alabama citizens better understand the COVID-19 data coming from the Alabama Department of Public Health (ADPH).

Today, the site provides the most comprehensive view of COVID-19 data for the state of Alabama.

With a background in graphic and web design, David took the mess provided by the state and turned it into a data empire — one he plans to continue to build on and expand long “after” COVID-19.

BamaTracker.com has been visited by more than 1.5 million people since March 2020, and has been used by government leaders, medical professionals, teachers and many others as a source for current data and trends on COVID-19 in Alabama.

“I never imagined the impact it would have on so many people and am honored to have been able to build the site and have it become such a valuable resource,” said Marconnet.

Marconnet said one of his goals for Bama Tracker was to present the data in a way that any person could understand, so that they could better follow the course of the pandemic.

Another goal, Marconnet said, was to present the data from an apolitical viewpoint, though he quickly found out how even tweeting “Have a good weekend and wear a mask” became politically charged during the pandemic.

A recent article in the Redstone Rocket praised David’s efforts, noting:

Marconnet launched the third iteration of the website in January – with expanded data about COVID-19 vaccine efforts. He said that with the new website, “it has been an exercise in finding out what the health department cares about, what the hospitals care about, what people care about.”

The Redstone Rocket
Screenshot of http://www.BamaTracker.com

A few comments from those who nominated David:

“This resource has been my go-to for information on the pandemic in Alabama since its inception. I also deeply appreciate how David holds ADPH accountable when data is unclear, delayed, or potentially misleading.”

“From the start of the pandemic, David sought to capture state level data and feed it into visuals and models that are more readily understood by the public. His level of transparency in data reporting is outstanding. He quickly became the go-to source for individuals, local media, and scientists within the state. “

Spread the word:

@davidmarconnet, creator of @BamaTracker, is a #COVID19 #DataHero worthy of all the praise, and a finalist for the COVID-19 #DataHeroAwards. See all nominees at: DataHeroAwards.org. Check out his data resources at: http://www.BamaTracker.com

Dr. Ellen Eaton

The Specialists Group (Alabama)

Dr. Ellen Eaton is an Infectious Diseases Physician with a Masters in Public Health at the University of Alabama.

Dr. Ellen Eaton (Alabama)

In March 2020, Dr. Eaton began a Facebook page, “Dr. Ellen Eaton Coronavirus Updates,” to combat misinformation she noticed was being shared by friends and family on social media.

“I knew that Alabama would be disproportionately affected by COVID due to low public health access, literacy, and other social determinants of health,” said Dr. Eaton.

“So, I committed my free time to improving public health through data-driven COVID messaging initially targeted to friends, family, friends of friends in the Deep South.”

Dr. Eaton now has more than 12,800 followers on Facebook, 32,497 weekly reaches, and 25,313 weekly engagements with viewers from across the US, Canada, Hong Kong, Syria, and India, she said.

“The most important aspect of my page is clear, consistent, evidence-based clinical and policy updates tailored to a lay audience with little to no medical background (like my hometown of Dothan, Alabama).”

A few comments from those who nominated Dr. Eaton:

“Dr. Eaton has done an exceptional job keeping people updated and informed about COVID-19, and sorting through all the misinformation online. Her posts have been one of the only sources I’ve trusted throughout this pandemic. (And she’s also treating patients at UAB!) She’s a data hero and a healthcare hero too!”

Click here to see Dr. Ellen Eaton’s Facebook page.

Click here to follow Dr. Ellen Eaton’s Twitter page.