The first confirmed COVID-19 case in the United States in Washington startled Avi Schiffmann, even though he was one of the first to track the virus world-wide.
Hearing about the virus in China late in 2019, Avi sought out data tables and feeds but came up with none. The primary sources for developments and reporting COVID-19 were scattered across the internet, written in Mandarin, Korean and Japanese – languages Avi doesn’t speak.
So he began collecting as much data as he could, and by January 2020, he had one of the first sites tracking the virus worldwide.
His work earned him a 2020 Webby Award, presented to him Dr. Anthony Fauci for his work tracking COVID-19.
“As we collectively navigate the severe impact of COVID-19, including the difficult, but critical calls for nationwide social distancing, the Internet has become the lifeblood of people looking for accurate information about the novel coronavirus and the necessary steps to combat it. Since launching the site on December 29th, Schiffmann’s tracking tool has been an invaluable resource that sounded the alarm on the virus and its spread, notably calling attention to its severity long before many global officials. At a time when the spread of misinformation can be so detrimental to our efforts, the site has provided over 100 million visitors with accurate real-time data.”
Today, Avi runs his site between classes, applying to college, and homework.
He works with UNESCO, the European Union, and is now a youth ambassador to the United Nations.
He’s not interested in working on teleporting, by the way. He just wants to create revolutionary technology to recreate the internet, and work on cybernetics for creating sustainable technologies to combat the impacts of climate change. Or he’ll become a cottage cheese farmer. “Who knows,” he said.
A few comments from those who nominated Avi:
“He was just 17 years old & knew the pandemic was coming in November 2019. Look at what he did & think of how far he can go. He’s amazing.”
Only a handful of states made data access and transparency during the early days of COVID-19 as difficult as Iowa.
Sara Anne Willette (Iowa)
Even now, Iowa remains one of the few states that does not provide data about COVID-19 cases in schools.
But Sara Anne Willette does.
Sara invested all her efforts toward building the Iowa COVID-19 Tracker site early in the pandemic, and continues to provide the public with all of the data the state makes available in an easily-consumable, accessible and transparent way.
For Sara, running the site and keeping Iowans informed is personal; of the first three cases announced in the state, Sara personally knew two of them.
“I track Iowa’s COVID-19 data for two reasons,” she said. “First, the daily data presented by the State of Iowa contains numerous errors and lacks accessibility. The majority of the data must be hand-scraped, a task to which most working Iowans are unable to devote hours per day. Second, as a disabled American with Common Variable Immune Deficiency, I am in a unique position to assist as many Iowans as possible with risk assessment regarding infectious pathogens in their communities and schools.”
Sara made enemies within her state government and her own political party by pressing for more COVID-19 data access and transparency.
Reynolds allegedly called Sara an “excel warrior” during a press conference last May, disparaging her and others for tracking and reporting cases in the state.
Sara continues to update her data daily, with help from several of her graduate students at Iowa State University who she hired to assist with the project.
When @GeoRebekah’s home was invaded by police, I realized that my family isn’t safe from Reynolds’ and IA GOP’s wrath.
Doing the right thing means I’m in danger. I still do the right thing.
— Iowa COVID-19 Tracker: Sara Anne Willette (@amethystarlight) March 3, 2021
A few words from those who nominated Sara:
“Sara has been tracking data since last March, and has been especially important given that the data published by our state has been incorrect, manipulated, and misleading. The view we have on our State’s official website is not current, so does not reflect current conditions. Sara provides data updates by county twice a day, and also data for school districts and colleges and universities in the state. Her transparency is unparalleled.”
“Sara has been accessible and has been rooting out inconsistencies this whole time. She reports honestly to Iowa in real time. She is a hero. She has been silenced and has been relentless with our science denying Governor.”
“Sara began by tracking the data released by the Iowa Dept of Public Health and presenting it in more accessible ways on her own web site. She has contacted the state DPH to try to get them to compute test positivity rates correctly (they still won’t). She independently tracks data on infections and quarantines among school students and staff, which the state does not do in a meaningful way.”
NPR interview with Eileen White and Caroline Buckee, from Dec. 13, 2020
Eileen White resigned from her position as the sole epidemiologist in the newly-formed Fishers, Indiana health department after the mayor began interfering with how data was being represented to the public.
Eileen White (Indiana)
“It became clear that no matter what I did to help make data more transparent for my community, I simply could not honestly communicate about the data when working in local public health in Indiana, amidst a huge amount of political pressure.”
“It went very public very quickly and was incredibly uncomfortable,” Eileen said.
Eileen became a reluctant, though much-needed voice for reason and transparency, challenging the misleading information being put out by her local officials, especially when that misleading data related to schools and school safety during COVID-19.
“We developed community metrics to help guide our community health around risk and school closings and openings,” she explained. “The metrics said we were in one stage, and the mayor decided that we were in another and told the schools to open fully when that’s not what the metrics indicated.”
So she left a health department she had uprooted her life to assist.
She created “Public Health Is Your Job, Too” as both a website and Facebook resource for those looking to better understand COVID-19 in her state, and to advocate for science communication and public health.
She received threats. Her neighbors shunned her. Several times, she’d go outside and find her car doors left opened or ajar.
In the end, she had to move.
Eileen was by no means a public figure before she left the health department – she averaged about one tweet a month before she quit in protest of the local government’s political interference in science and medicine. After she resigned, she started a Facebook page to share public health data with the public.
Eileen wanted to adhere to the guidelines on reopening schools, but the mayor didn’t. She wanted communication about the risk of schools to be clear, but the mayor didn’t. And when push came to shove, her own health department wouldn’t back her up against the political interests trying to minimize the impact their policy decisions would cause.
“There are many of us that have felt powerless, silenced. The data may indicate one thing. The policy decisions that are made at the top by the politicians and even some of the directors do not follow data,” Eileen remembers.
“We have to be careful to say what we know and don’t know and why. What we know about kids is still under investigation, everything so far indicates they spread at least as much as adults,” she wrote.
Indeed, Mayor Scott Fadness made unilateral changes to the policies regarding reopening school, reminding the health department during one public meeting that it wasn’t up to the health department when and how schools opened.
“I did my best to hold the local and state health departments accountable for decision making and poor data interpretation , and held our state accountable for the absolute gutting of public health funding and investment in Indiana,” she said.”
Still somewhat shaken from the near-constant assault of her work and her personal life, led by anti-maskers, anti-lockdowners and “open schools NOW” pushers, Eileen looks forward to what’s next for her, even if it isn’t where she expected life to take her.
“It’s been a very long year, but I take heart that my work in data and public health education have informed Fishers, Indianapolis and surrounding areas on how to look at the information they are being given, how to ask questions, and how to challenge a political narrative that is very clearly without real, solid, vetted data behind it.”
Eileen graciously requested not to be considered a finalist, noting on her Facebook page: “I have been a strong advocate for science, data and my community, but I have gone nowhere near the levels of work of my co-nominees. These amazing folks are doing incredible work, and I hope that their careers are improved with this honor and well-deserved attention.”
We disagree.
Eileen’s commitment to science education under immense pressure and even threats exemplifies everything this awards program is about. Still somewhat uncomfortable with her new-founded celebrity and trying to work her way through the emotional toll of her experiences, Eileen struggles to be brave. Yet, those who do not struggle to be brave are not nearly as heroic as those who must fight each day to find it within themselves to go on.
Even though Eileen may not (yet) be a national figure like some of other nominees, she shares the stage with equal credibility, transparency, advocacy, and grit as everyone else.
Our program was designed not to give praise to those who already have the lectern, but to recognize those whose work within their communities, states or regions across the US and Canada profoundly changed conversations, challenged misinformation, and who paid a price in doing so.
Click above to listen to our interview with Olivier Drouin!
Olivier Drouin (Canada – Quebec)
Olivier Drouin ventured into the treacherous waters of reporting cases in COVID-19 schools when Quebec dodged the responsibility last August.
Despite the lack of transparency in many schools, Olivier worked with teachers unions, parents, and schools to produce his data analysis on COVID-19 in schools.
Infectiously kind, gracious, and humble, Olivier took on the task of reporting school cases in Quebec, much in the same way The Covid Monitor did in the United States.
“I am a team of one – single parent of two teenage daughters and VP technology for a large company in Montreal,” Olivier said. “This is volunteer work and I have spent at least 1000 hours since August 26th, 2020.”
Olivier Drouin’s website greets visitors with a pointed note:
The mission of this citizen initiative for transparency of data on schools affected by COVID is to make information available, accessible and intelligible in real time to school stakeholders (parents, teachers, staff members).
The site uses the creativity, intelligence and know-how of the community to create content, develop ideas, solve a problem or carry out an innovative project, all at a lower cost. This approach is commonly known as crowdsourcing.
The project is based on the strength of collective intelligence using crowdsourcing. The site publishes the number of schools affected by at least one positive case of COVID since August 26th.
The information comes from the public and is validated with a copy of the letter issued by public health or the school administration. This list is an evolving and non-exhaustive list. It is updated several times a day. You can submit positive COVID cases in your schools, whether you are a parent, teacher, service center employee or citizen.
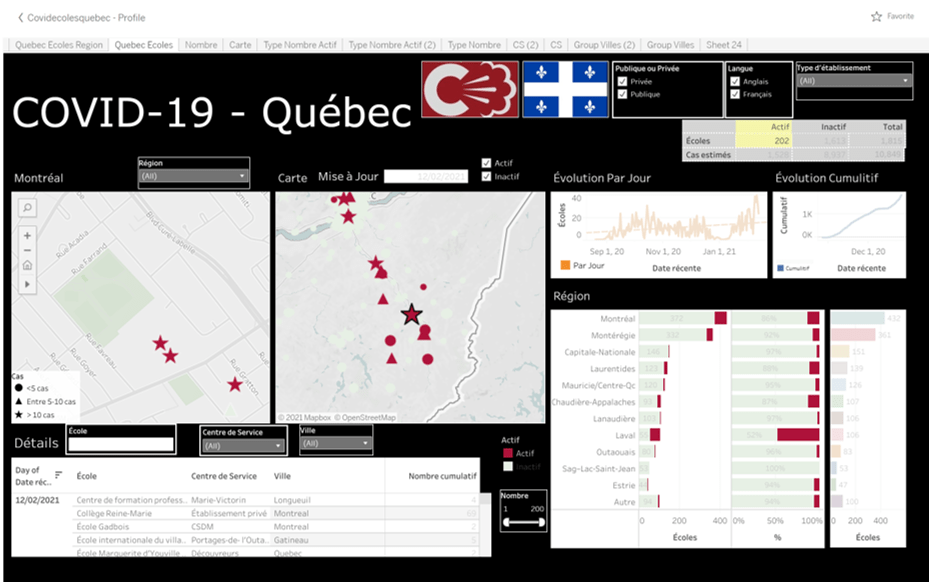
Drouin, who lives on Nuns’ Island, started tweeting about the pandemic in the summer, concerned about the government’s back-to-school plan. In September, Drouin founded a volunteer website, CovidEcolesQuebec.org, posting cases of COVID-19 in schools across the province, based on letters by principals sent to him from parents. The website quickly became one of the most visited in the province.
Drouin has also advocated for better ventilation in schools, including the installation of portable air purifiers in classrooms.
“Twitter has a real-time aspect to it, contrary to other social media,” Drouin explained.
Cases by grade-level groups on Olivier’s website, CovidEcolesQuebec.org
“It is easy to connect quickly on content with experts (from) around the world on a given topic. When it came time to launch CovidEcolesQuebec.org, it was simply an extension of my community involvement and I felt it was important to create a separate account to promote the site and create a community of like-minded followers that would amplify the message and help make this crowdsourcing website a success.”
“One parent, as a volunteer work, has been tracking all Quebec Covid cases in school since August 26th, at a time when the government was refusing to disclose the data. Using crowdsourcing method, he publishes official letters sent by school and public health to parents that confirm a case and compiles it in real time on a geospatial map. He manages also a twitter account and Facebook page. he was mentioned by elected officials at the national assembly of Quebec, covered in other 200 news media articles and name Most fascinating Montreal of 2020 by CJAD radio.”
Megan Messerly’s 40th post in her weekly “Coronavirus Contextualized” series is the epitome of high-quality data reporting.
Megan Messerly (Nevada)
Whatever data is out there, Megan pulls in, analyzes and, as the title suggests, puts into context.
Her work for the Nevada Independent put her at the top of the pack in our Press Cohort, and rightfully so – her work manages to take the wealth of data that could be overwhelming and make it easily consumable, understandable, and accessible.
“It is not possible to independently calculate the test positivity rate based on test encounters because the state only reports the number of positive cases, not the number of positive test encounters,” her latest post noted. “However, the state does provide this number, calculated as an average over a 14-day period with a seven-day lag. As of Wednesday, that number was 11.3 percent, down from a high of 21.7 percent on Jan. 13. In September, before cases started to increase, the test positivity rate was 6.1 percent — meaning that test positivity is still nearly double what it once was.”
In her own words:
“In early March, when Nevada announced its first two cases of COVID-19, there was nowhere to turn for reliable data. The data lived scattered among various state and county websites and press releases.”
“So, I created The Nevada Independent’s first COVID infographic — which lived in our weekly live blogs — nearly a week and a half before the state set up its data portal. Since then, I’ve detailed and analyzed the latest COVID data in Nevada in my “Coronavirus Contextualized” series, which has published almost every single week since April 1.”
“In June, I transitioned the infographic into a full-fledged data page, which I, by myself, have updated multiple times a day, every single day, since then, including weekends and holidays.”
“I do want to give a shout out to my colleagues, who helped me with data collection for the first couple of months of the pandemic, and to our chief technology officer CJ Keeney, who helped me set up the backend of our data collection process and who is always there to answer any questions I have when something goes awry.”
View a sample of Megan’s work below
Click here to read the above article.
Click here to read the article
Nevada COVID-19 updates for 2/18:
🧪 Test positivity is down: 7-day avg is 16.7% or 11.3% using test encounters 🏥 Hospitalizations are down: 698 (-42) 😷 Cases are down: 513 new cases/day on avg (-46) 📅 25 days until COVID-19 restrictions loosen further pic.twitter.com/21H5SbxXrF
“To me, I think the most important part of my reporting, whether the graphics, the “Coronavirus Contextualized” series, or other individual stories I’ve written, has been providing clear information to Nevadans — not only keep them informed about the reality of the situation in our state, but to help them make educated decisions about what steps they are going to take personally to respond to the pandemic. I’m so grateful to everyone who has followed along for the last year!”
A few words from some of those who nominated Megan:
“Megan has reported our daily case, test positivity and hospitalization numbers, as well as the corresponding graphs, every day through the pandemic. She gives cliffs for every conference call of our state COVID team. She’s accessible and puts up with all the crap that the anti-maskers can give her.”
“Megan originated the “Coronavirus in Nevada” site early in the pandemic and has been the main staffer to keep this data site populated. We, as users, know that it is reliable and up to the hour with the latest data. And it’s very comprehensive, especially with the county by county statistics. Plus, her Twitter account and health newsletter keeps us informed on statements from health officials and where we can get vaccinated. Living in a rural county with no TV station, I would have felt so underinformed without her. She is Las Vegas-based, but does a wonderful job with informing residents of other counties, including little old Elko Co. where I live. And the best part is that she still maintains her beat covering politics and other health issues. A tireless journalist with a VERY appreciative Twitter following. We never want her to leave Nevada Indy, but when she gets interviewed by national media, we are reminded that someone will make her an offer she can’t refuse.”
Andrew Berens, a population health and geospatial analyst with the Louisiana Department of Health, built and has maintained since March 2020 the Louisiana COVID-19 Information Dashboard.
Andrew Berens (Louisiana)
Andrew has worked to make COVID data consistently and transparently available to the public and local officials.
In addition to the public facing work, Andrew assists the state with data cleaning and processing, and he response to request for assistance from data users, making the state’s data more widely available.
A few words from those who nominated Andrew:
“Andrew worked quickly in March to establish one of the first state-level COVID dashboards when the first Louisiana case was reported, publishing one up in time to report Louisiana’s first death. Since then he has continuously worked to improve data quality and increase transparency, advocating to make high-quality data easily downloadable. Now that the vaccine rollout has begun, Andrew has stepped up on the team tasked with cleaning, enriching, validating, and reporting vaccination data as well to ensure these data are also accurately and transparently shared with the public.”
“Throughout the pandemic Andrew has worked directly with local officials, answering questions and helping to integrate state data in to their local informational products. He has also taken time to answer citizen questions regarding the dashboard, ensuring the people of Louisiana understand the data being presented.”
At the start of the COVID-19 pandemic Dr. Amber Schmidtke recognized there was a large gap between the way that scientists communicate and how non-scientists receive information.
So she made it her mission to reach out to other experts, journalists and the public to work on clear and effective communication about COVID-19.
And she did so in a state that has been among the least transparent and accessible with Coronavirus data in the country — Georgia.
“She has shared and broken down the real facts and meaning behind the Covid numbers for us Georgians when we could not trust our health department to report the data honestly,” wrote one person who nominated Dr. Schmidtke for our program.
Friendly, patient and comforting, she has become one of the most trusted voices in Georgia for analyzing and understanding the COVID-19 pandemic.
A self-described “data nerd,” Dr. Schmidtke worked at Mercer University as a professor in the School of Medicine when the pandemic started.
Dr. Schmidtke earned a Ph.D. in medical microbiology and immunology from Creighton University in Nebraska, and completed her postdoctoral research fellowship in the CDC’s Pertussis and Diphtheria Laboratory, later becoming a microbiologist for the Atlanta-based health protection agency.
She has combined her roles as a public health specialist and college educator to provide meaningful analysis and explanation of disease trends to the public through a popular newsletter and podcast.
As a result of those communication efforts she was invited to serve as a member of the Georgia COVID-19 Data State Task Force, advising government agencies on how to package their complex data to meet the needs of the public.
Dr. Schmidtke frequently informs the public on the issue of school safety during COVID-19, wading into an obscenely politicized debate, using the science and data to advocate for ensuring CDC protocols are closely followed and that teachers are able to get vaccinated.
Dr. Schmidtke warned the public in February when a national cheerleading competition in Atlanta brought more than 40,000 people to the event. She noted the timing of the event, and the risk attendees might bring home or spread the B.1.1.7 variant, of which Georgia ranks fifth in the country for confirmed cases.
An article from the Mercer University newsletter detailed how Dr. Schmidtke joined the state task force to help with presenting data to the public.
“She works most closely with the Georgia Geospatial Information Office, which maps data, and has helped the health department refine how the information is presented on its website,” the article stated.
When data from Georgia would go missing or was suspicious, Dr. Schmidtke called them out, worked to find answers, and led her state (and the country) by example with her steadfast, data-driven approach.
Though with her calming and disarming demeaner, she tries to always end on a positive note, even if the risk is grave.
“I understand and acknowledge that anxiety that people are feeling. The good news is the measures we’ve been recommending this whole time will help us to limit transmission of these new variants and that’s really what we should be focused on right now,” said Dr. Schmidtke in an interview last month.
Dr. Schmidtke’s continued energy and enthusiasm for reporting data and being an accessible, reliable, trustworthy source for Georgia and beyond make her a true data hero.
A few comments from those who nominated Dr. Schmidtke:
“Dr. Schmidtke not only kept up with very hard to acquire data to keep Georgians informed when the state failed to do so, she also put it in a very accessible format. She has been informative about the state’s true numbers (GA never reported rapid test results) and realistic in her assessments of hospital capacities. Her emails have been calming because they are honest and although they contain a lot of data they are so clear they are never overwhelming. I’m grateful for her hard work, her empathy, and her patience.”
“As Georgia DOH struggled with their own reporting, Amber filled in the blanks with her multiple-times-a-week analysis and explanations. She made the data come to life and wasn’t afraid to give her opinion on what it meant. Her explanations are so clear. She also then replies to comments and answers questions. She moved to Kansas and picked up reporting there but continued with GA!”
If the true measure of a person’s character can be derived from how they treat their inferiors, then Dr. Anne Zink would score aces.
Dr. Anne Zink (Alaska)
Members of her team have publicly praised her expertise, humility, and empathy.
“She encourages Alaskans to take care of each other, and to check in on neighbors who may need a helping hand,” wrote Sarah Erkmann Ward, an Anchorage communications consultant who worked with Dr. Zink during the crisis.
“She is the right person at the right moment that we never knew existed,” Erkmann told Alaska Public Radio.
Dr. Zink is the Chief Medical Officer for the Alaska Department of Health and Social Services, and she began her regular updates on COVID-19 long before the virus reached her state.
“I want to make sure you have the latest information at your fingertips,” Dr. Zink wrote in her monthly newsletter in February 2020.
“Dr. Anne Zink from Alaska is a total badass and has been keeping us up to date with accurate data since early March 2020”
“Using a data driven approach, she has wonderfully informed Alaskans about how actions have consequences in the covid crisis (both positive and negative) She has a great humility, but is so deserving of awards! “
Eizabeth Shulok started tracking COVID-19 in California in May 2020.
Elizabeth Shulok (California)
Using her expertise as a data scientist, she built her own website to track, analyze and visualize data in San Diego County.
“The data tells the story; I just paint the picture,” said Shulok.
Elizabeth works with the press to produce accurate data visualizations, including a recent project to map the CDC schools guidance by zip code in her state.
Elizabeth wrestled with the pushback she received when she started reporting on cases in K-12 schools, finding that many in San Diego county (and online) would harass, threaten and berate experts who cautioned about what was known and what was speculation about kids, teachers and school staff.
“The violence coming from some of the pandemic deniers has made me hesitant to post openly about COVID-19,” Elizabeth said.
Despite the risk, Elizabeth pressed on, continued to track and report cases (including cases in schools), and challenged early misconceptions and lack of transparency in her area.
“I wasn’t convinced we knew enough about the role children play in the pandemic so I decided to see what the data shows,” said Shulok. “The county provides data on COVID-19, but doesn’t display it in a way to see how transmission varies by age group over time. So I created my own charts to try to get a better picture of what is happening with kids in San Diego County and ended up expanding from there.”
Elizabeth feared for her own safety at times, even going so far as to remove her name from her projects. But seeing activists using her data confront the anti-science crowd online and in the news encouraged her.
“It has shifted my perspective. And seeing them go on air, doing interviews to counter the Reopen Now group’s narrative, and getting bashed online, puts my work into perspective. What I’m doing is fairly neutral and less controversial,” she said.
Elizabeth provides all of the data free to the public with complete transparency of where it comes from, which is almost entirely primary sources.
A few comments from those who nominated Elizabeth:
“Her data analysis has provided insights and views that have illuminated areas of concern, highlighted gaps in tracking and brought into question policies in place.”
“As a concerned parent and data scientist, Liz used her skills to compile an amazing data dashboard, coding to periodically scrape data from publicly available sources in an easy-to-use, centralized format to help better under the role of schools in the coronavirus pandemic. Since we know that asymptomatic spread and a lack of testing are leading to serious undercounts, Liz’s dashboard provides a critical lower bound of confirmed, official cases and other data points that allow for better policy decisions knowing it is the tip of the iceberg.”