A note from the COVID-19 Data Hero Awards program organizer

Grateful.

The time I’ve spent processing nominations, interviewing nominees, writing their profiles, and working with our panel to select winners of our Inaugural COVID-19 Data Hero Awards left me truly grateful.

With the wealth of resources across the United States and Canada, from a college student tracking cases in the White House to a pediatrician developing and communicating vaccines, I can imagine no greater range of talents than those we showcase in this program.

When I made the decision to start this program in January 2021, I envisioned it as a way to build a map or master directory of sorts so that the public and other experts could learn from those who have made data communication central to their efforts during COVID-19.

While I have spoken to a handful of the people on this list in the past, and have heard of a few dozen more, even I did not appreciate how hard people from all backgrounds and levels of expertise, with limited resources or minimal notoriety, were conquering the virus in their communities through effective communication of data and science. 

As the awards portion of our program closes, our directory will continue to grow, so please nominate whoever has been a data hero for you during this pandemic for recognition on our site.

The purpose of this program has always been recognition, not competition. The awards allow us to highlight 26 exceptional data communicators and advocates, but that in no way means that every other person submitted is not equally deserving of praise.

Some of those who we considered as finalists graciously bowed out, wanting to remain in the program but yielding the spotlight to those who have been under cloudier skies. 

And while we received nominations for brave heroes like Dr. Cleavon Gilman, who lost his job for simply telling the public that Arizona had no staffed ICU beds, and devoted volunteers like those behind the vaccine-alerts.com project in Oklahoma, we tried to maintain our focus in consideration of the final awards — those who made data, data-driven analysis and science the center of their public communications.

We broke up our list of nominees into five categories. Within each group you’ll find a range of expertise, experience and personalities. We wanted our finalists to represent their peers, while acknowledging the handful who stood out among them.

In the end, the decision to select just one hero per group to recognize as a “winner” became too difficult. So for each cohort of heroes, we decided to recognize a winner, a runner-up, and all other nominees with a reward for their efforts. We also want to reward those who won the public vote through online voting, which more than 35,000 unique IP addresses cast ballots for.

Online Voting Winners:

The NewcomersRachel Woodul (North Carolina)
The PressMary Landers (Georgia)
The ProfessionalsMatthew Holloway (Missouri)
The SpecialistsDr. Emily Smith (Texas)
The ProvocateursRyan Imgrund (Ontario, Canada)

We also decided to honor three data hero nominees who have spent the last year working on COVID-19 in public service or as volunteers. 

After all awards are given, our program will give $10,000 in awards to our finalists – far beyond our original budget of $3,000, but worth every penny.

I have discovered so many amazing new people through this program, and I hope you will, too.

Congratulations to all of our nominees, finalists and winners. The community of resources built during COVID-19 should be widely recognized and celebrated for the efforts they put into this unprecedented time. 

Thank you,

Rebekah Jones

Note: All award recipients will be announced at 5:00 PM Eastern Time on Wednesday, March 31, 2021, here on our website and on Twitter.

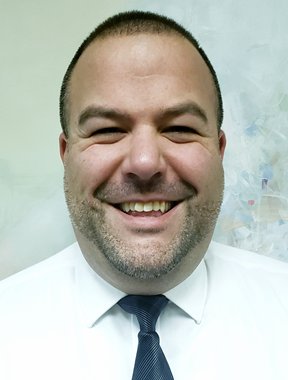
Lee Worden

The Professionals Cohort (California)

Lee Worden (California)

I’m an applied mathematician who has worked on evolutionary biology and cooperative social dynamics. For the last ten years or so I’ve been doing modeling of infectious disease transmission, most recently as per of Travis Porco’s group in the Francis I. Proctor Foundation at UCSF, and I’ve been working on COVID since March 2020. 

At first I was working on fairly complex models of the disease process, which we used to provide projections of hospital demand to local and state health departments for planning purposes.

While I’m still doing COVID-19 modeling research, I noticed that people were consistently asking for up-to-date estimates of the reproduction number in the Bay Area.

The reproduction number, referred to as R – the number of cases caused by a single case on average – is a summary of how strongly the outbreak is growing or shrinking, that can be used to evaluate how well control strategies are working.

Estimating reproduction numbers can be made as sophisticated and complex as you like, but useful estimates can be done simply, and I realized that I could provide them as a service. I adapted some code I already had (having done similar analyses of measles and Ebola outbreaks) to make local and state R values from each day’s COVID case counts. To make it into a daily tracker website I assembled a team of volunteers from friends and colleagues to get it set up and keep it going, and we have had it running at https://ca-covid-r.info since June 2020. 


I believe this nomination is for the website, so as far as I’m concerned it is the team who is nominated: https://ca-covid-r.info/#Credits

As for myself, I’m continuing to work on COVID modeling focusing on outbreaks in congregate settings that drive racial disparities in the disease’s spread. In particular I’m working with the CalPROTECT project (https://amend.us/calprotect/) on describing and analyzing the horrible, extreme outbreaks that have occurred in the California prison system.

Being a descendant of refugees from the German concentration camps where so many people died from infectious diseases, with the racial disparities in imprisonment in the US, and the pandemic control measures that are necessary – serious reduction in prison population – not being carried out, I am committed to documenting and opposing this abuse of prisoners. 

Click here to follow Lee on Twitter

Jay Metzger

Jay Metzger says 2020 was quite a year:

Jay Metzger (Rhode Island)

As the GIS Manager for the Rhode Island Department of Health (RIDOH), Jay was activated onto the Planning team for the COVID-19 Pandemic. As the GIS Planner for the Rhode Island COVID-19 Pandemic Response, Jay was tasked with bringing GIS solutions to the pandemic response, and to maintain ethical data governance working with the COVID-19 Data Epidemiologists.

Jay created and deployed the RIDOH COVID-19 Data ArcGIS Hub Site, which started as one Hub site and has grown to over ten total sites in the RIDOH COVID-19 Data Hub environment. Jay’s RIDOH GIS COVID-19 Team were the driving force behind the data visualizations on the Hub sites. Since its inception in April of 2020, the site has seen 3 million hits, and has become an integral resource among internal RIDOH staff, external partners, and the public as a whole.

Jay was also the acting President for the NEURISA Board of Directors in the year 2020. During his role as President Jay lead a group of amazing GIS Professionals, through the COVID-19 Pandemic, and into a very successful NEURISA Day 2020 Conference.

The conference brought together GIS Professionals worldwide, as the NEURISA team hosted three days of discussions about the power of data and GIS. The NEURISA Day 2020 conference’s agenda spot lighted important topics such as Social Justice and Equity, Climate Change, and Making a Difference in our Communities, but was anchored by a Keynote discussion about Data and Ethics with Rebekah Jones

Jay is incredibly proud of the work that he has been involved with, and is completely honored to be mentioned for this award. When not wearing his GIS cape, Jay is busy with his wife, Kelly, and two daughters, Zoe and Violet, as they adventure across Rhode Island. Excelsior!  

Andi Egbert

The Press Cohort (Minnesota)

Andi Egbert (Minnesota)

In early April 2020, when the CDC was not providing any COVID-19 mortality data by race and ethnicity, Senior Researcher Andi Egbert and the small team of the Research Lab at American Public Media developed the “Color of Coronavirus” to monitor and trumpet racially inequitable deaths by state and across the nation.

They began scouring state websites, building a database, and producing regular web updates that continued over the course of the next year—to underscore the widely disproportionate toll that the virus was having on communities of color, stealing beloved family and community members at two to three times the rate of white residents.

Andi led the Lab’s efforts in imaging the project; data collection, standardization, visualization, and analysis; narrative-writing, age-adjusting the mortality rates; giving media interviews and connecting with many partners.

Rich with interactive features that make plain the cruel landscape that resulted from the virus’ intersection with systemic racism, Color of Coronavirus has been widely cited by local, national, and international media outlets; referenced in congressional testimony and academic journals; and incorporated into health practitioner training and college curricula. The project’s valuable data file has also been utilized by hundreds of researchers, practitioners and policymakers seeking to document and alter the inequitable toll of the virus.

A few words from those who nominated Andi:

“Andi led the APM Research Lab’s Color of Coronavirus, which was the first project to consistently track COVID-19 mortality rates by race and ethnicity, showing huge disparities in the impact of the pandemic. This work has been cited in the halls of Congress, academic journals, many leading national and international news outlets, and has been used by advocates seeking to change and improve our collective response to COVID-19.”

Chris McMahan

The Professionals Cohort (South Carolina)

Christopher McMahan (South Carolina)

About Chris:

I am an Associate Professor in the School of Mathematical and Statistical Sciences at Clemson University. As a statistician, my research interests include developing diagnostic testing strategies and infectious disease modeling.

At the onset of the COVID-19 pandemic, I joined an interdisciplinary public health team that was tasked with devising, evaluating, and operationalizing various mitigation strategies to slow the spread of COVID-19 at Clemson University.

I completed my Bachelor’s degree majoring in mathematics, minoring in physics, at Austin Peay State University, Clarksville, TN.

I then earned a master’s degree in mathematics at Western Kentucky University, Bowling Green, Kentucky. I then completed a doctoral degree in statistics at the University of South Carolina, Columbia, SC.

After completing my Ph.D., I joined Clemson University as an assistant professor, and I was recently promoted to the rank of associate. In addition to my teaching responsibilities, I also consult with Biorealm and serve as a Visiting Professor at BINUS University.

My research interests include, but are not limited to, categorical data analysis, group testing, survival data analysis, nonparametric methods, measurement error models, spatio-temporal modeling, statistical computing, Bayesian parametric/nonparametric estimation, high dimensional regression techniques, epidemiology/public health, and biomedical applications.

A few words from those who nominated Chris:

“Dr. McMahan is a statistician at Clemson University where he has used his skillset to help keep our community safe. He helped develop and implement a novel surveillance-based informative testing strategy for SARS-CoV-2 detection. That strategy and the continuous work he has done to improve the models has allowed our University to safely remain open. Dr. McMahan has mentored several graduate students, preparing them to lead the next pandemic, and cares deeply about their growth. He is a voice of reason – calm and collected – never seeking credit – but responsible for so much of our success. Chris has become a close friend and I feel very lucky to have gotten to know him over this past year. He and his wife have brought my family several meals while we were struggling with a cancer diagnosis. He reaches out to us constantly. In short, he continually has stepped up in the continuous crises that all of us have experienced since the beginning of the pandemic. He is a data hero.”

Click here to see the Clemson University COVID-19 Dashboard

Lior Rennert

The Specialists Cohort (South Carolina)

From the Greenville Journal:

Lior Rennert (South Carolina)

Throughout the COVID-19 pandemicLior Rennert has been knee-deep in researching the best ways to study the spread of the novel coronavirus in order to mitigate its reach. 

Rennert, assistant professor in Clemson’s department of public health sciences and a biostatistician, is leading a significant part of the university’s response to COVID-19.

Last fall, Rennert and his team decided to look into pre-arrival testing before students came back to campus.

“We essentially developed models that showed that if you test everybody before arrival or upon arrival, you can severely limit the outbreak size and delay them as well,” says Rennert. He says that he gives Clemson credit for conducting pre-arrival testing even though the Centers for Disease Control and Prevention had yet to explicitly recommend it.

Another aspect of planning against the coronavirus focused on what Rennert calls a new “surveillance-based informative testing” strategy — research currently under peer-review. Through random testing, the university identified hot spots in residence halls ​and targeted their testing resources to test these students. Such targeted tests were twice as likely to detect positive cases compared to random tests, ​which allowed university officials to quickly act to isolate and quarantine students and help stem the spread of the virus.

“It was really effective,” Rennert says. “It drove down prevalence by almost 40% over a two-week implementation period.”

Dr. Rennert’s ‘Tasks’:

  1. Leading modeling efforts at Clemson University (along with Christopher McMahan and Corey Kalbaugh) to evaluate and implement testing strategies for mitigation of SARS-CoV-2 spread
  2. Implemented surveillance-based informative testing on the university campus, where I would monitor Covid-19 prevalence on campus and direct testing resources to residence halls experiencing outbreaks
    1. https://greenvillejournal.com/healthcare/clemson-professor-develops-models-to-show-covid-19-spread-and-help-vaccine-rollout/
    2. Manuscript detailing this strategy accepted for publication at The Lancet Child and Adolescent Health (link to come in next 7-10 days)
  3. Directing Clemson’s Covid-19 dashboard
    1. https://www.clemson.edu/covid-19/testing/dashboard.html
  4. Working with South Carolina health systems and departments of health to efficiently allocate vaccines to underserved communities (using data-driven models)

A few words from those who nominated Lior:

“Dr. Rennert is a biostatistician at Clemson University where he has used his skillset to help keep our community safe. He helped develop and implement a novel surveillance-based informative testing strategy for SARS-CoV-2 detection. That strategy and the continuous work he has done to improve the models has allowed our University to safely remain open. At the same time, Dr. Rennert has been a critical voice to our statewide vaccine rollout. He has developed models to help increase the equitable distribution of vaccines in SC. I am an epidemiologist and I credit Lior with helping to keep me positive during what has been an incredibly challenging year for my profession. Personally, he has become a close friend and I am really lucky to get to work with such a thoughtful and kind person. He cares about others well-being above his own and represents the best of what we can be as public health professionals. He is a data hero to all of us in SC.”

Click here to see the Clemson University COVID-19 Dashboard

Lauren Gardner

The Specialists Cohort (Maryland)

Dr. Lauren Gardner (Maryland)

Lauren Gardner joined the team behind the internationally-heralded Johns Hopkins University COVID-19 dashboard, along with creator Ensheng Dong, who was her Ph.D. student at the time.

Dr. Lauren Gardner and her team at the CSSE built the COVID-19 global tracking map in January 2020, creating the most comprehensive publicly available data set on the pandemic.

Dr. Gardner’s data drives much of the CRC’s analysis and serves as a vital resource for millions of users to track the pandemic.

Since the pandemic began, Johns Hopkins experts have collecting and analyzing domestic and international data about COVID-19. The effort began on Jan. 22, 2020 with one of the first global maps to track Covid-19 cases and deaths. It evolved on March 3, 2020 into the Johns Hopkins Coronavirus Resource Center. The CRC’s more than 260 sources include 182 from local, state, and federal agencies in the United States.

A few words from those who nominated Dr. Gardner:

“It is the best dashboard with the most detailed data and visualization. “

Click here to visit the Johns Hopkins COVID-19 Dashboard

Dillon Richards

The Press Cohort (Oklahoma)

Dillon Richards (Oklahoma)

Dillon Richards is a reporter with ABC 5 Oklahoma City (KOKO) who has been covering COVID-19 in his state since the first few cases were disclosed.

Dillon tackled some of the most emotional and raw human stories throughout the pandemic through his data and reporting.

Now, he reports daily on vaccine distribution, providing Oklahomans with information about whether they qualify, where to make appointments, where vaccines are/are not in supply, and more.

In 2018, Richards won an award from the Pennsylvania Association of Broadcasters for a story about first responders to a heroin overdose.

Richards is originally from south Florida and went to high school and college in Georgia. He earned a degree in Digital and Broadcast Journalism from the University of Georgia. He interned at WMAZ-TV in Macon, Georgia.

A few words from those who nominated Dillon:

“Dillon does an amazing job keeping us updated here in Oklahoma City, along with Kassie. Completely appreciate their details keeping us in the know.”

Click here to follow Dillon on Twitter

Chris Prener

The Professionals Cohort (Missouri)

Chris Prener (Missouri)

I am an Assistant Professor of Sociology at Saint Louis University (St. Louis, MO), specializing in urban and medical sociology as well as GIS.

I’ve been posting nightly updates on Twitter [1] and my Missouri tracking website [2] since late March, 2020. I also have a weekly newsletter [3] that recaps weekly trends in COVID across Missouri.

I’ve focused my time on creating accessible maps and data visualizations that bring together related data from separate dashboards, such as my regional ZIP code-level maps of St. Louis [4] and Kansas City [5].

In building the site, I’ve also created an open source data workflow that has supported local public health departments, hospital systems, and media outlets.

[1] https://twitter.com/chrisprener
[2] https://slu-opengis.github.io/covid_daily_viz/
[3] https://chrisprener.substack.com
[4] https://slu-opengis.github.io/covid_daily_viz/stl.html#Infection_Rates_by_ZCTA_(Zip_Code)
[5] https://slu-opengis.github.io/covid_daily_viz/kc.html#Infection_Rates_by_ZCTA_(Zip_Code)

Click here to visit Chris’ website
Click here to follow Chris on Twitter